POSITION VS. TIME GRAPHS
Describing Motion with Position vs. Time Graphs
-Motion of objects in 1-dimensional kinematics can be represented by words, diagrams, numbers, equations
and graphs.
-The specific features of the motion of objects are demonstrated by the
shape and the slope of the lines on a position vs. time graph.
-The slope of the line reveals useful information about the velocity of the object.
-As the slope goes, so goes the velocity.
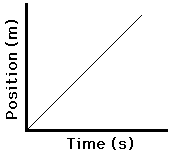
-If the velocity is constant, then the slope is constant
(i.e., a straight line).
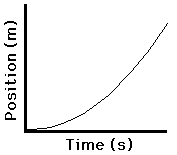
-If the velocity is changing, then the slope is
changing (i.e. a curved line).
-If the velocity is positive, then the
slope is positive (i.e., moving upwards and to the right).
-Consider a car moving with a rightward (+). The position vs. time graphs for constant velocity and changing velocity (acceleration) - are depicted as follows.
Constant Velocity Positive Velocity
Positive Velocity Changing Velocity (acceleration)
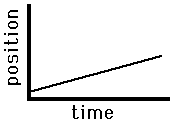
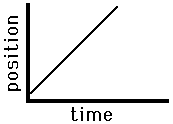
Slow, Rightward(+) Fast, Rightward(+)
Constant Velocity Constant Velocity
Slow, Leftward(-) Fast, Leftward(-)
Constant Velocity Constant Velocity
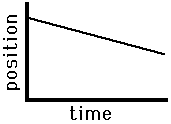
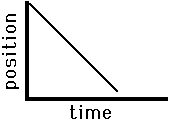
Leftward (-) Velocity Leftward (-) Velocity
Slow to Fast (accelerate) Fast to Slow (decelerate)
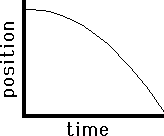
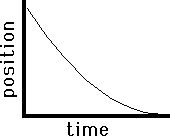


No comments:
Post a Comment